PeColor color matching software operation method
Pecolor color matching software provides a complete color management platform including color matching, correction, archiving, recipe and quality control. Pecolor is connected with the spectrophotometer YS3060/YS6060. With 3NH high-end color measurement technology and extensive coverage of technical support network, we provide customers with excellent color management system and powerful pigment color matching database to help customers from R&D standards to suppliers. Individual assessments enable integrated operations. Below we introduce the PeColor color matching software operation method.
A. PeColor color matching operation method
1. Establish a basic color databaseThe accuracy of the base color database directly affects the accuracy of color matching and color matching efficiency. The brand of the basic color material, the number of types and the selection of the printing substrate should be determined according to the actual production situation of the enterprise. Generally, it is necessary to select more than ten basic color materials for use, and establish two colors suitable for coated paper and non-coated paper. Material database.
(1) Each base color material and transparent color material are respectively formulated into 10 g (accuracy 0.001 g) color paste in 7 different ratios of 1%, 5%, 10%, 25%, 50%, 75%, 100%, and the like.
(2) Make a good spline of the color paste, require 3 color splines for each sample ink, and 3 transparent white ink samples and 3 white paper samples for printing.
(3) Preheat the spectrophotometer for 3 minutes and connect to the computer color matching system. After the color material on the color spline is completely dried (about 1 hour at normal temperature), the spectral reflectance data of the white paper sample, the transparent white ink color sample, and all the different concentration base ink color samples are sequentially measured. In the color matching system, the number of measurement times is set to 6, that is, two points (selecting a portion with uniform ink color) are taken on each color spline or white paper sample, and the total measurement is performed six times in order to minimize the measurement error.
Here, the spectral reflectance data is measured for the color spline, because the spectral reflectivity ultimately determines the hue, brightness, and saturation of a certain color, with a high degree of accuracy. The spectrophotometer will convert the spectral reflectance data of each measurement point collected by each measurement through complicated calculation, and display it in an intuitive Lab or LcM straight (Lab and Lch can be automatically converted, in this case, the Lch value is selected). After the 6 measurements are transmitted to the computer, the system automatically calculates the average and records it. Thereafter, the price of each color material, the total amount of color material to be blended, and the like are input in the system, and after all the work is completed, the basic color material database is built. The entire base color database database creation process is very cumbersome and requires careful and careful operation.
2. Sample measurement
The color data of the sample (the color requested by the customer, also called the standard sample) is measured by the spectrophotometer and transmitted to the color matching system.
The software records the reflectance spectrum data of the sample color and converts it into a Lab value for display.
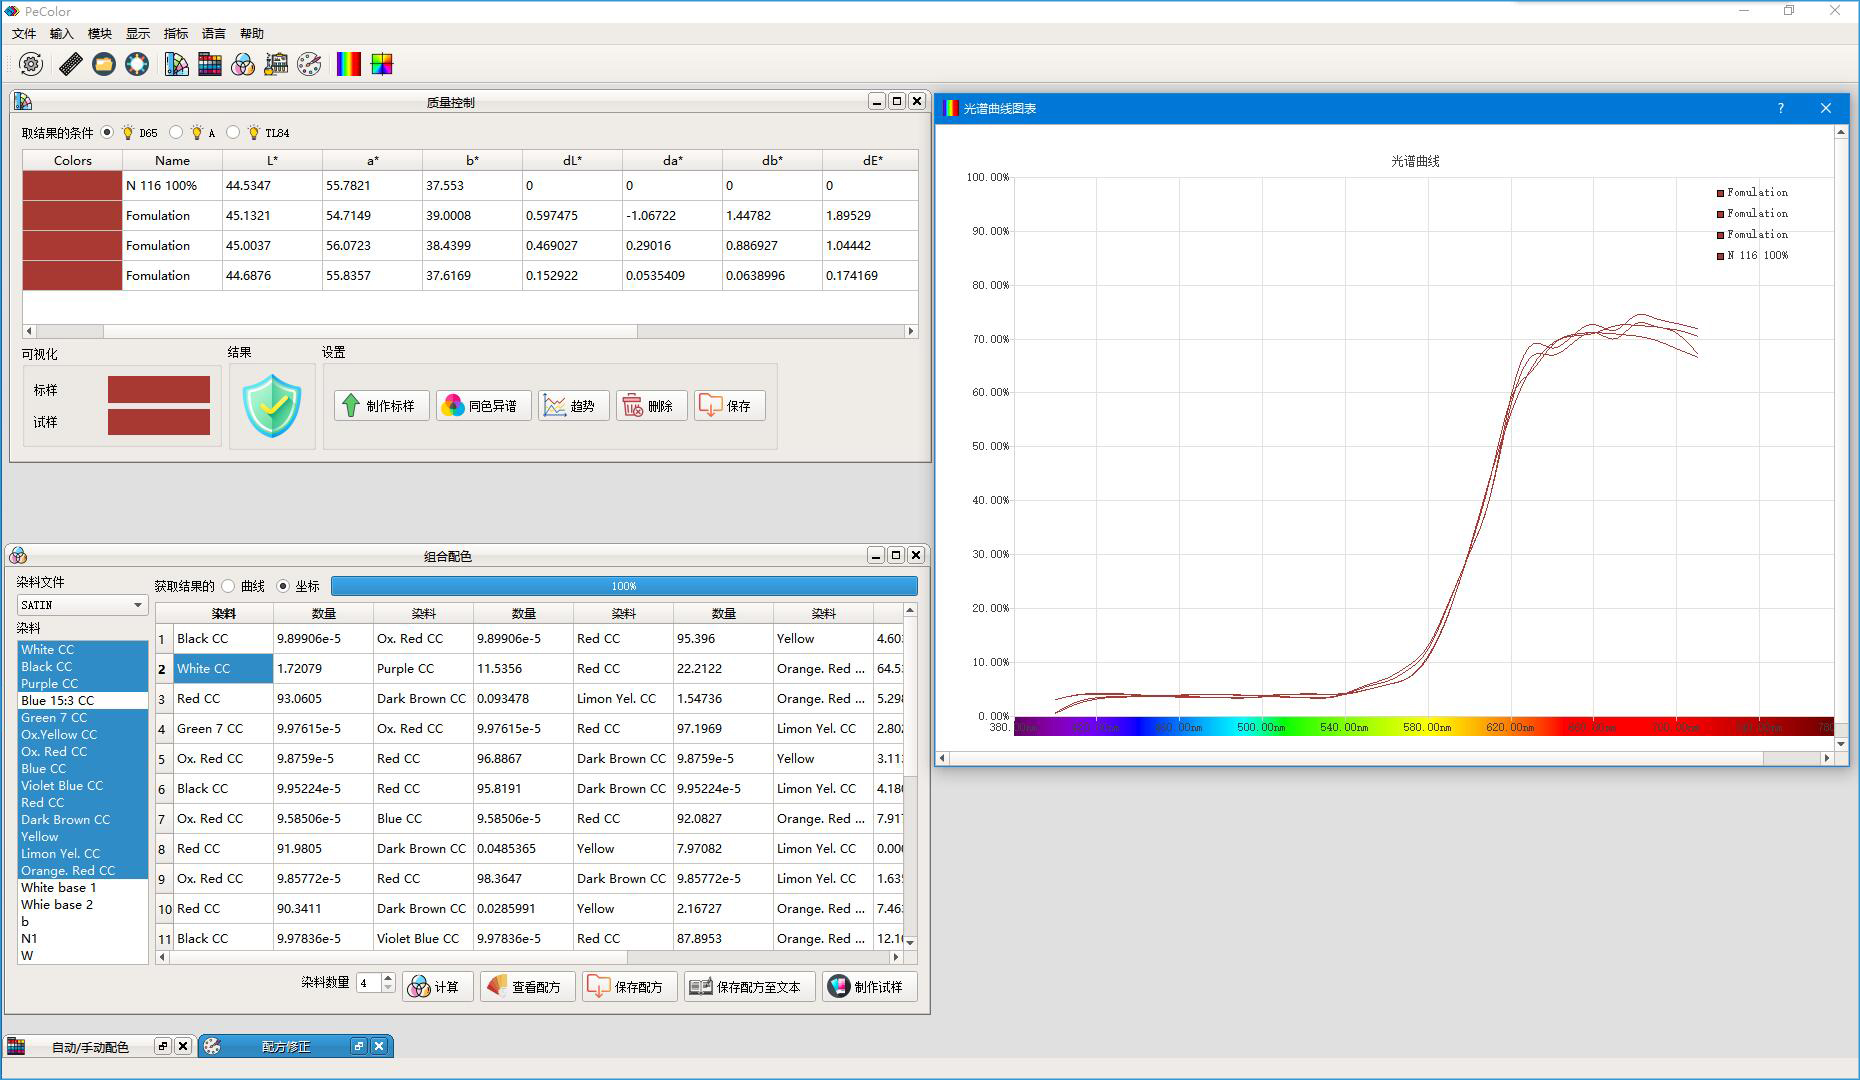
The color matching system makes a reasonable match from the basic database according to the data of the standard sample, and quickly generates a spot color formula. The system can provide multiple optional recipes and sort the recipes by various indicators to select the optimal color scheme. These indicators include color difference, reflectance curve coincidence degree, metachromatic level, color matching cost, etc. The priority order of these indicators is determined by the user, and the system sorts the corresponding recipes.
3. Manual color adjustment
According to the color number and proportion of the color material displayed by the formula, according to the total amount of the previously set, according to the respective proportions, the corresponding amount of color materials are respectively weighed by the high-precision electronic balance, and the artificially adjusted and uniform.
4. Coloring samples
The prepared color paste is used to make excellent splines, the operation method and parameter standard are the same as the step (2) of establishing the basic ink database, and three color splines are prepared for use.
5. Color sample measurement
The dried color spline is used to measure the spectral reflectance data of 6 points by the spectrophotometer. The operation method is the same as the step (3) of establishing the basic color material database, and the system automatically obtains the average value and records it.
6. Color difference calculation
The system firstly obtains the difference between the standard sample and the sample obtained by the formula (hereinafter referred to as the formula color) according to the preset color difference, and calculates the color difference between the two.
7. Recipe correction
If the color difference between the formula color and the standard is too large and is not within the requirements, you can select “Revise Formula” under the software menu, and the software will give a new solution. Repeat the work of manual color correction, coloring sample, color sample measurement, etc. according to the corrected formula ratio until the color difference value is within the required range, and the formula is qualified.
B. PeColor color matching accuracy evaluation
1. Color difference evaluation
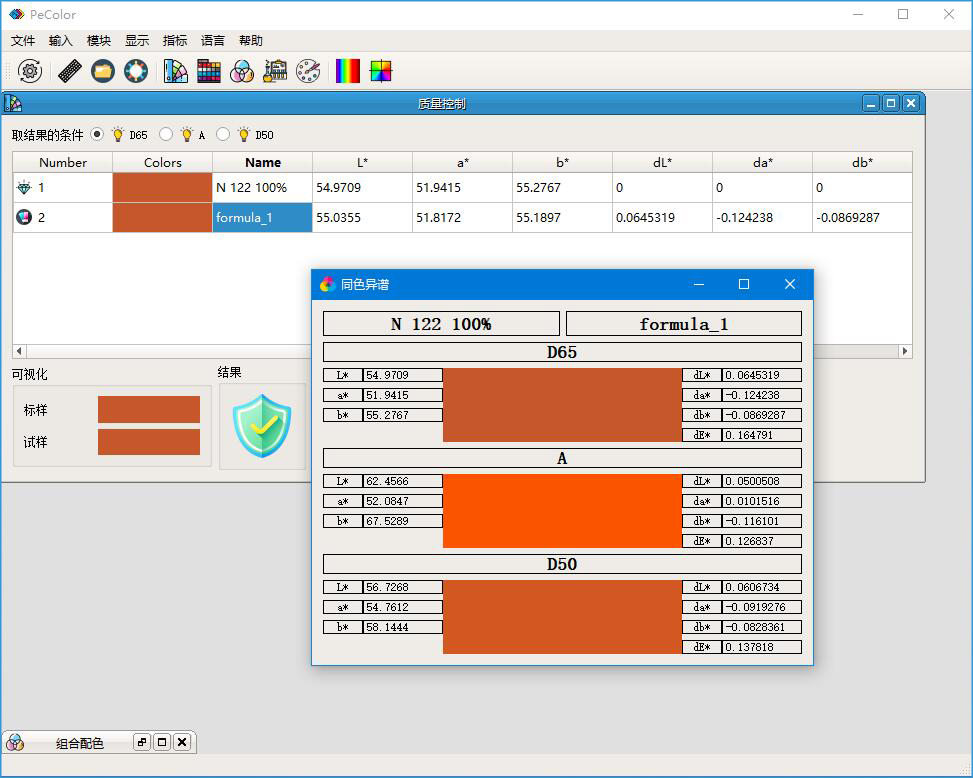
The color difference is a numerical representation of the difference between the two colors. The smaller the value, the smaller the color difference. The larger the value, the larger the color difference. The difference between the color difference and the light source selected by the spectrophotometer is different. The color difference is also different. As shown in the figure, under the three light source conditions of D65, A, and D5, the calculated color difference values are 0.16, 0.12, and 0.13, respectively, regardless of which color source is used to calculate the color difference value, which is in the range of 0.0 to 0.5. The difference between the target color and the formula color is small, reaching the high-end product color matching standard required by the industry.
2. Evaluation of the coincidence degree of reflectance curve
The degree of coincidence refers to the degree of coincidence of the spectral reflectance curves of the two colors. By comparing and analyzing the spectral reflectance curves of the target color and the formula color, the difference between the two can be seen.
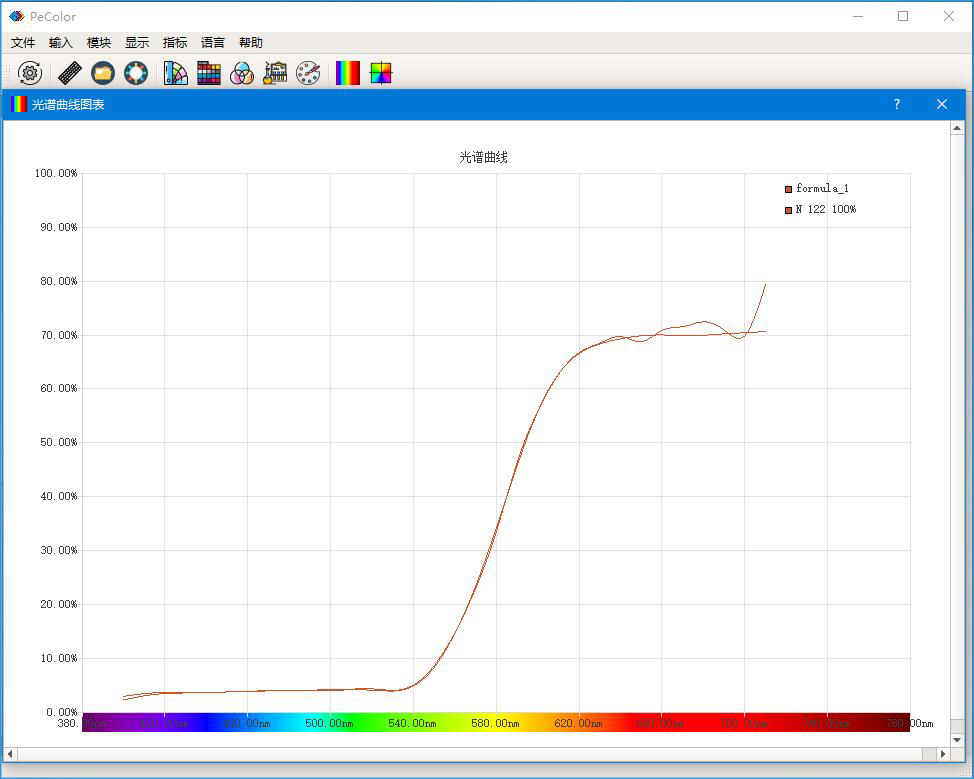
If the shape of the spectral reflectance curve is approximately the same, and there are more intersections and coincident segments, the degree of metamerism is low. The above figure shows the spectral reflectance curve of the target color and the formula color. The curves of the wavelengths are 420~630nm and the curves of 630~700nm are basically coincident, while the curves of the 620~700nm segments alternately fluctuate, indicating the reflectivity of the two wavelengths. There is a difference, there is a phenomenon of metamerism, and the degree of metamerism is very low due to the small color difference.
3. Evaluation of metamerism effect
If two color samples that look the same color under one light source are replaced by another, there is a significant difference between the two color samples. This phenomenon is called metamerism. The metamerism effect can be caused by changing the chromaticity observation condition or changing the illuminating body, but the former generally has little influence, mainly considering the metachromat effect caused by the change of the illumination condition. Each test patch of Figure 4 consists of a target color (left) and a recipe color (right). The color difference under the three illumination sources D65, A, and D50 is less than 0.5, further indicating the metamerism of the target color and the recipe color. The degree is low, and even if the lighting conditions are changed, the human eye does not feel the difference between the two.
Color matching is a complex operation involving light color theory, ink, paper, process and many other aspects. The computer color matching system uses the color spectrum to perform three-stimulus color matching, which is suitable for the characteristics of printing, coating and textile industries, reducing the burden on color matching personnel and improving the burden. The color quality, color matching speed and precision of the product increase the economic benefits. Although there are still many areas for computer color matching system to be perfected, such as different color differences calculated by three-stimulus color matching under different light sources, the color matching accuracy has a great relationship with the accuracy of the chromatogram, etc., but with the continuous advancement of computer technology The test instruments are more precise, various mathematical methods are constantly emerging, and the materials are gradually standardized and dataized. The computer color matching software will inevitably show incomparable superiority.